Chapter 6 Measures of Dispersion
Question 1.
A measure of dispersion is a good supplement to the central value in understanding a frequency distribution. Comment.
Answer:
Dispersion is the extent to which values in a distribution differ from the avarage of the distribution. Knowledge of only average is insufficient as it does not reflect the quantum of variation in values.
Measures of dispersion enhance the understanding of a distribution considerably by providing information about how much the actual value of items in a series deviate from the central value, e.g., per capita income gives only the average income but a measure of dispersion can tell you about income inequalities, thereby improving the understanding of the relative living standards of different sections of the society. Through value of dispersion one can better understand the distribution.
Thus a measure of dispersion is a good supplement to the central value in understanding a frequency distribution.
Question 2.
Which measure of dispersion is the best and how?
Answer:
Standard Deviation is considered to be the best measure of dispersion and is therefore the most widely used measure of dispersion.
- It is based on all values and thus provides information about the complete series. Because of this reason, a change in even one value affects the value of standard deviation.
- It is independent of origin but not of scale.
- It is us’eful in advanced statistical calculations like comparison of variability in two data sets.
- It can be used in testing of hypothesis.
- It is capable of further algebraic treatment.
Question 3.
Some measures of dispersion depend upon the spread of values whereas some calculate the variation of values from a central value. Do you agree?
Answer:
Yes, it is true that some measures of dispersion depend upon the spread of values, whereas some calculate the variation of values from the central value. Range and Quartile Deviation measure the dispersion by calculating the spread within which the value lie. Mean Deviation and Standard Deviation calculate the extent to which the values differ from the average or the central value.
Question 4.
In town, 25% of the persons earned more than ₹ 45,000 whereas 75% earned more than 18,000. Calculate the absolute and relative values of dispersion.
Answer:
25% of the persons earned more than ₹ 45,000. This implies that upper quartile Q3 = 45,000 75% earned more than 18,000. This implies that lower quartile Q1 =18,000
Absolute Measure of Dispersion = Q3 – Q1 = 45,000 – 18,000 = 27,000
Relative Measure of Dispersion
Co-efficient of Quartile Deviation

Question 5.
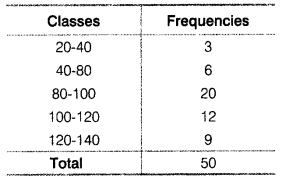
The yield of wheat and rice per acre for 10 districts of a state is as under
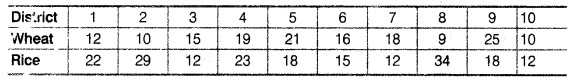
Calculate for each crop,
(i) Range
(ii) QD
(iii) Mean’Deviation about Mean
(iv) Mean Deviation about Median
(v) Standard Deviation
(vi) Which crop has greater variation?
(vii) Compare the value of different measures for each crop.
Answer:
(i) Range
(a) Wheat Highest value of distribution (H) = 25
Lowest value of distribution (L) = 9
Range = H – L = 25 – 9 = 16
(b) Rice Highest value of distribution (H) = 34
Lowest value of distribution (L)=12
Range = H – L = 34 – 12 = 22
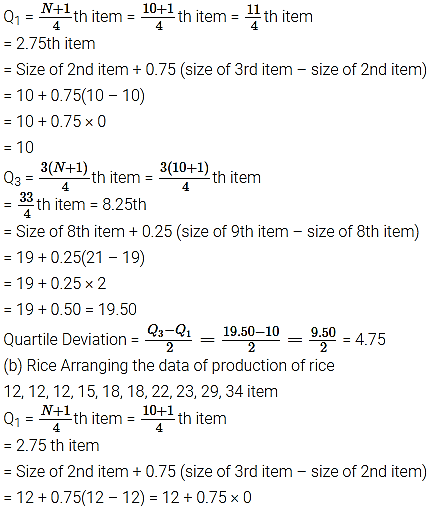
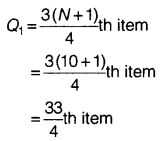
(ii) Quartile Deviation
(a) Wheat Arranging the production of wheat in increasing order 9, 10, 10, 12, 15, 16, 18, 19, 21, 25
= 12
= 8.25th item
= Size of 8th item + 0.25 (size of 9th item – size of 8th item)
= 23 + 0.25(29 – 23)
= 23 + 0.25 × 6
= 23 + 1.5
= 24.5
![]()
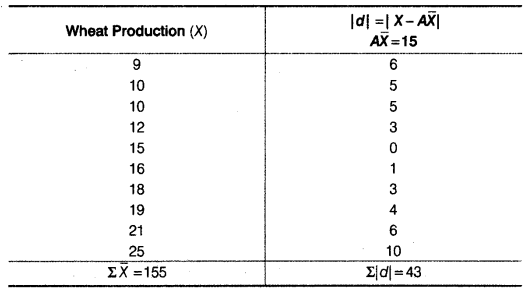
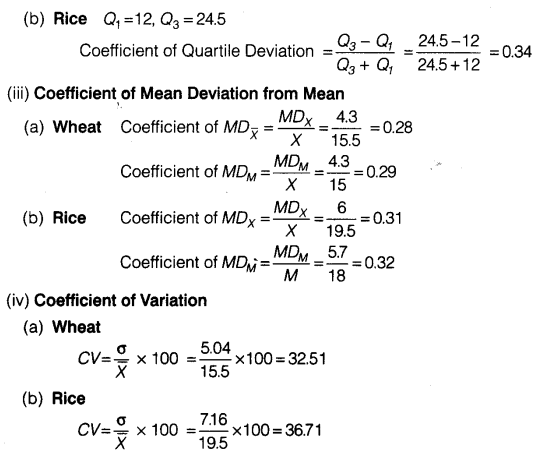
(iii) Mean Deviation about Mean
(a) Wheat
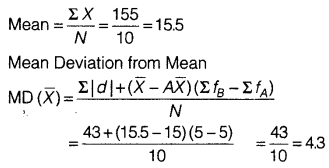
(b) Rice
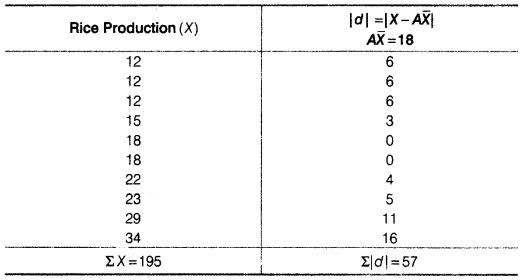
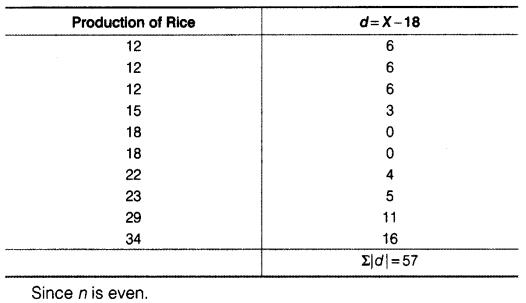
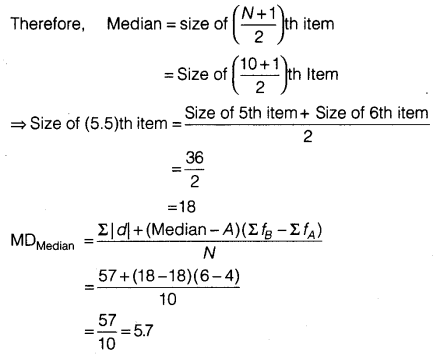
(iv) Mean Deviation about Median
(a) Wheat
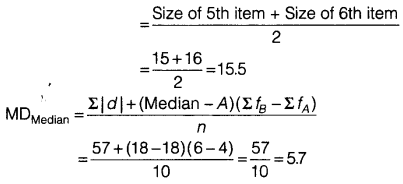
(b) Rice
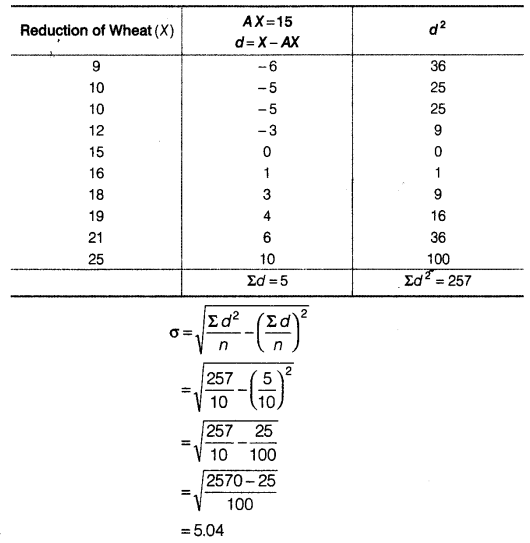
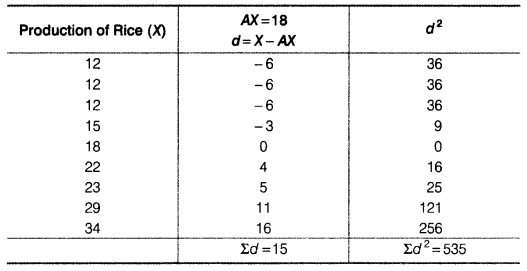
(v) Standard Deviation
(a) Wheat
(b) Rice
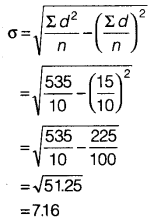
(vi) Coefficient of Variation
(a) Wheat
Rice crop has greater variation as the coefficient of variation is higher for rice as compared to that of wheat.
(vii) Rice crop has higher Range, Quartile Deviation, Mean Deviation about Mean, Mean Deviation about Median, Standard Deviation and Coefficient of Variation.
Question 6.
In the previous question, calculate the relative measures of variation and indicate the value which , in your opinion, is more reliable.
Answer:
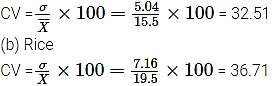
(i) Coefficient of Range
(a) Wheat
The coefficient of variation is more reliable than all other measures.
Question 7.
A batsman is to be selected for a cricket team. The choice is between X and Y on the basis of their scores in five previous scores which are
![]()
Which batsman should be selected if we want,
(i) a higher run-getter, or
(ii) a more reliable batsman in the team?
Answer:
Batsman X
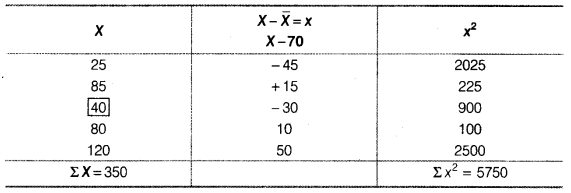
(i) Average of Batsman X is higher than that of Batsman Y, so he should be selected if we want a high scorer.
(ii) The Batsman Y is more reliable than Batsman X. This is because the coefficient of variation of Batsman X is higher than that of Batsman Y.
Question 8.
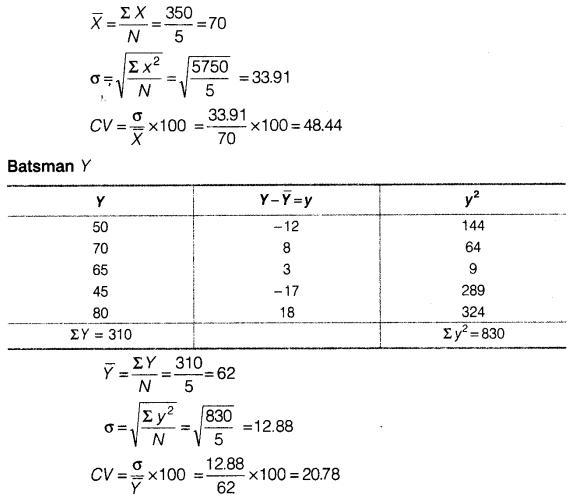
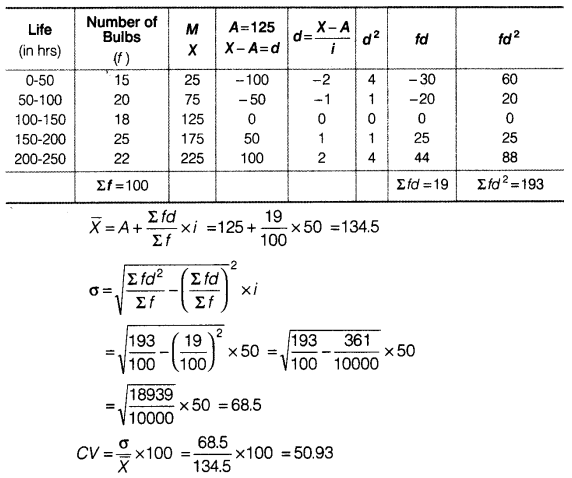
To check the quality of two brands of light bulbs, their life in burning hours was estimated as under for 100 bulbs of each brand.
(i) Which brand gives higher life?
(ii) Which brand is more dependable?
Answer:
For Brand A
For Brand B
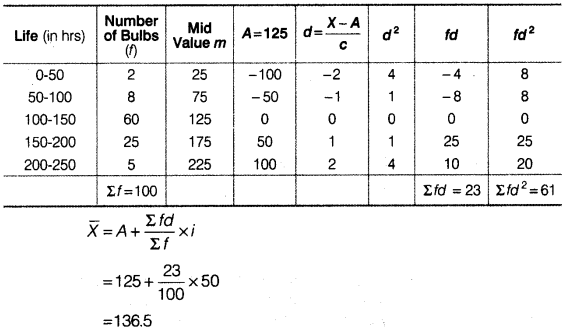
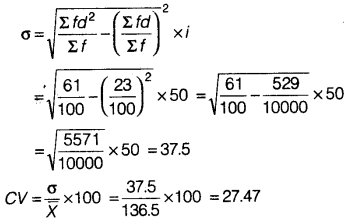
(i) The average life of bulb of Brand B is comparatively higher than that of Brand A.
(ii) The bulbs of Brand B are more dependable as CV of Brand B is lesser than CV of Brand A.
Question 9.
Average daily wage of 50 workers of a factory was ₹ 200 with a Standard Deviation of ₹ 40. Each worker is given a raise of ₹ 20. What is the new average daily wage and standard deviation? Have wages become more or less uniform?
Answer:
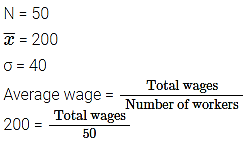
So, total wages = 200 × 50 = ₹ 10,000
Now, increase in wage rate = ₹20
Total raise = 50 × 20= ₹ 1,000
Total wage after raise = ₹ 10,000 + 1,000 = ₹ 11,000
![]()
Thus, Mean increases by the amount of increase in wage of each worker as the absolute increase was equal for all.
Standard Deviation will remain the same that is ₹40 as Standard Deviation is independent of origin and hence addition of equal amount in all the values will not cause any change in the Standard Deviation.
Uniformity of wages can be seen by coefficient of variation.
Previously, the coefficient of variation was
CV = ×100 = (40/200) × 100 = 20
The new coefficient of variation after wage increase is given by
CV = ×100 = (40/220) × 100 = 18.18
This shows that wages have become more uniform now as the new CV is lower.
Question 10.
If in the previous question, each worker is given a hike of 10% in wages, how are the Mean and Standard Deviation values affected?
Answer:
Average wage = ₹ 200
Hike in wages = 10%
Since arithmetic mean is not independent of scale, the mean will also increase by 10%.
= ×200 = ₹ 20
Hence, the new Mean will be
200 + 20 = ₹ 220
Standard Deviation is also not independent of scale, hence, the Standard Deviation will also increase by 10% Initial Standard Deviation = ₹ 40
So, New Standard Deviation = ₹40 +10% of 40
= ₹ (40 + 4)
= ₹ 44
Question 11.
Calculate the Mean Deviation using Mean and Standard Deviation for the following distribution.
Answer:
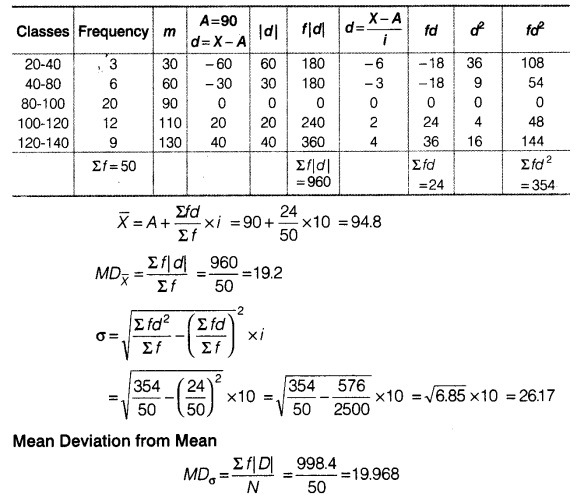
Question 12.
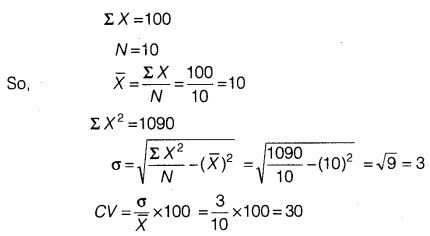
The sum of 10 values is 100 and the sum of their squares is 1090. Find out the coefficient of variation.
Answer: